
OLYMPIA, WA – Washington State’s economy gained an estimated 11,900 jobs (seasonally adjusted) and the monthly unemployment rate decreased to 3.8% in June.
“The gain in employment outpaced a modest rise in the labor force (+2,900) to help drive the unemployment rate down to 3.8%,” according to Employment Security Department State Economist Paul Turek. “The last time the unemployment rate was this low was in February 2020.”
From the Employment Security Department:
Visit ESD’s website to view the entire Monthly Employment Report for June.
ESD paid unemployment benefits to 56,067 people in June, an increase of 820 paid claims over the previous month. Increases in paid claims within the educational services and information sectors contributed to the overall increase in paid claims over the month.
National unemployment rate
The national unemployment rate decreased in June from 3.7% to 3.6%. For comparison, the national unemployment rate (revised) for June 2022 was 3.6%.
Updated state preliminary data for May 2023
- The preliminary estimated gain of 2,900 jobs for May 2023 was revised to a gain of 4,700 jobs.
- The seasonally adjusted monthly unemployment rate was confirmed at 4.1%.
Modest labor force growth
The state’s labor force in June numbered 4,068,100 – an increase of 2,900 people from the previous month.
In the Seattle/Bellevue/Everett region, the labor force increased by 8,000 over the same period.
Labor force is defined as the total number of people, both employed and unemployed, over the age of 16. Layoffs and labor force participation are not necessarily connected. When people are laid off but still seeking work, they remain a part of the labor force. A drop in the labor force means people have left work and haven’t been actively seeking employment for more than four weeks.
From June 2022 to June 2023, the state’s labor force increased by 85,177, while the Seattle/Bellevue/Everett region increased by 28,700.
From May to June 2023, the number of people who were unemployed statewide decreased from 165,000 to 154,500. In the Seattle/Bellevue/Everett region, the number of people who were unemployed increased from 54,100 to 54,900 over the same period.
Solid employment gains
Private sector employment increased by 8,800 jobs from May to June while government employment increased by 3,100 jobs.
Of the industry sectors, in June:
- Seven expanded.
- Six contracted.
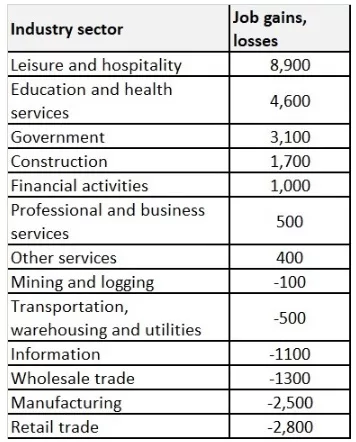
Here are some key increases and decreases:
- Leisure and hospitality employment increased by 8,900 overall, with 5,200 jobs added in food services and drinking places.
- The number of jobs in education and health services increased by 4,600 overall, with 3,100 jobs gained in social assistance.
- Professional and business services employment increased by 500 overall, with 800 jobs gained in professional, scientific and technical services.
- Manufacturing employment fell by 2,500, led by 1,700 jobs lost in food manufacturing.
- Retail trade employment decreased by 2,800 overall, with 900 jobs lost by food and beverage stores.
Annual employment growth
Washington gained an estimated 117,900 jobs from June 2022 to June 2023, not seasonally adjusted. Private sector employment rose by 3.1%, up an estimated 92,300 jobs, while public sector employment rose by 4.5% — up an estimated 25,600 jobs.
From June 2022 – June 2023, 12 major industry sectors expanded and one contracted
The three industry sectors with the largest employment gains year over year, not seasonally adjusted, were:
- Education and health services, up 32,700 jobs.
- Government, up 25,600 jobs.
- Leisure and hospitality, up 25,200 jobs.
The Information sector contracted, losing 5,500 jobs between June 2022 – June 2023.
Table 1: Washington’s total jobs

*Revised from previous preliminary estimates. Preliminary monthly estimates for job losses or gains are based on a small Bureau of Labor Statistics payroll survey. Actual figures reported the following month are based on a more complete survey.
Table 2: Job gains and losses by industry for May

Labor market information
See more labor market information and tools, including interactive Tableau graphics, to highlight popular information and data.